GW6 BGE-Grounded RepTok Attention: LPIPS and CLIP
Methodological Note
This page is an exploratory sweep over attention-module hyperparameters. I trained the full grid over number of heads, head size, and learning rate, using the frozen GW model. The attention modules were optimized only for normalized RepTok latent MSE; LPIPS and CLIP are measured afterward as downstream diagnostics of image quality and caption-image alignment.
There is a double-dipping risk if we simply keep the attention run with the best LPIPS or CLIP score on this page: we would be selecting a model based on the same readout used to evaluate it, and a partly random advantage could be mistaken for a stable rule. The safer interpretation is to use this grid to understand how attention capacity and optimization settings affect the downstream metrics, not to claim a final best model.
A cleaner final protocol would choose the attention configuration from a predeclared proxy, for example a latent metric or scalar-grid objective that was previously associated with better LPIPS or CLIP, or from a separate validation split. The final result should then be evaluated once on held-out tasks, ideally across the full radar plot rather than only BGE-to-RepTok. This page is therefore a preliminary tool for deciding what attention settings are worth testing next.
Ranking Diagnostics
Each point is one trained attention module. The plot asks whether attention settings that improve image realism under LPIPS also improve text-image alignment under CLIP. Equal fusion is shown as the baseline; the best LPIPS and best CLIP models are highlighted.

Run-To-Run Strategy Correlations
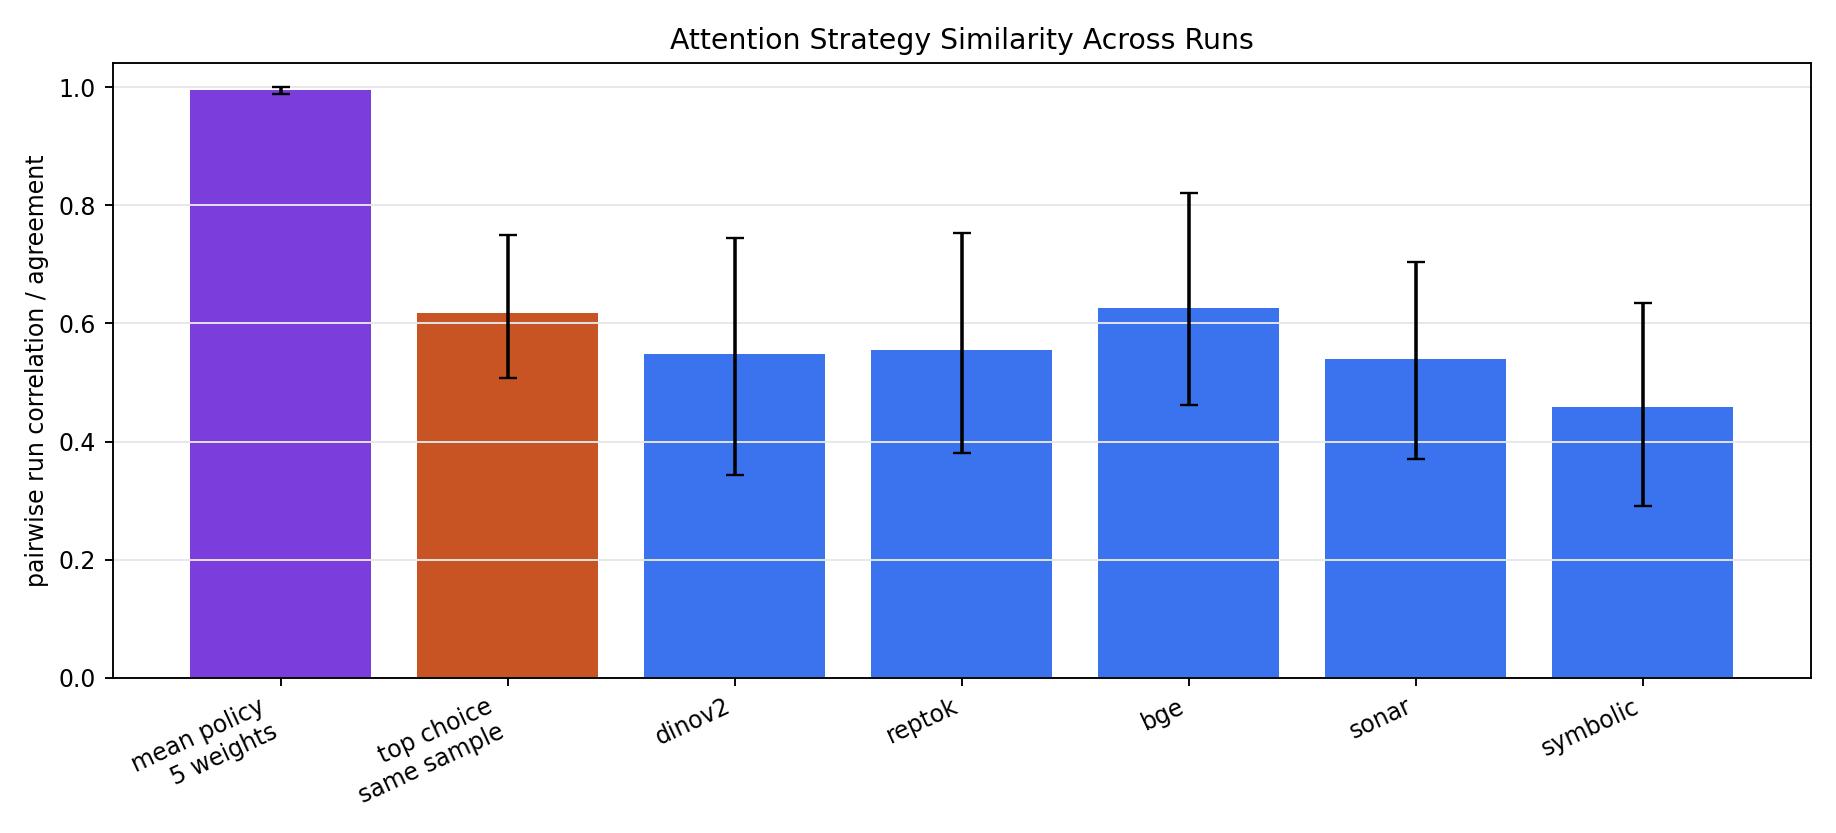
This plot asks whether the attention modules learned a real input-dependent policy, and whether different runs make the same choices for the same inputs. The mean-policy bar compares each run's average five coefficients, which are almost perfectly correlated across runs. The top-choice bar instead measures how often two runs pick the same strongest modality for the same sample, averaged over all model pairs; this is far below 100%, so the samplewise routing strategies are not identical.
Attention Learning Curves
These curves ask whether the attention modules converged, whether they consistently improved latent MSE, and whether the models that are best for latent MSE are also best for LPIPS or CLIP. The highlighted runs show that the best latent-MSE model is not the same as the best CLIP or LPIPS model. In particular, the best-CLIP run was still reducing MSE, leaving open whether longer training would improve CLIP further or whether its CLIP advantage comes from not fully optimizing MSE.

Qualitative Comparison
This grid compares equal fusion, the best LPIPS attention model, and the best CLIP attention model. The visual differences are modest overall. Some individual samples look better under the CLIP-selected model, while others favor the LPIPS-selected model, so this qualitative panel should be read as a sanity check rather than a decisive ranking.

Raw CSV: all_attention_lpips_clip.csv. Summary JSON: summary.json.